
Platform
From 1866 to this morning.
Sixty-plus agents, running continuously, so the answer is already in the warehouse when you ask the question.
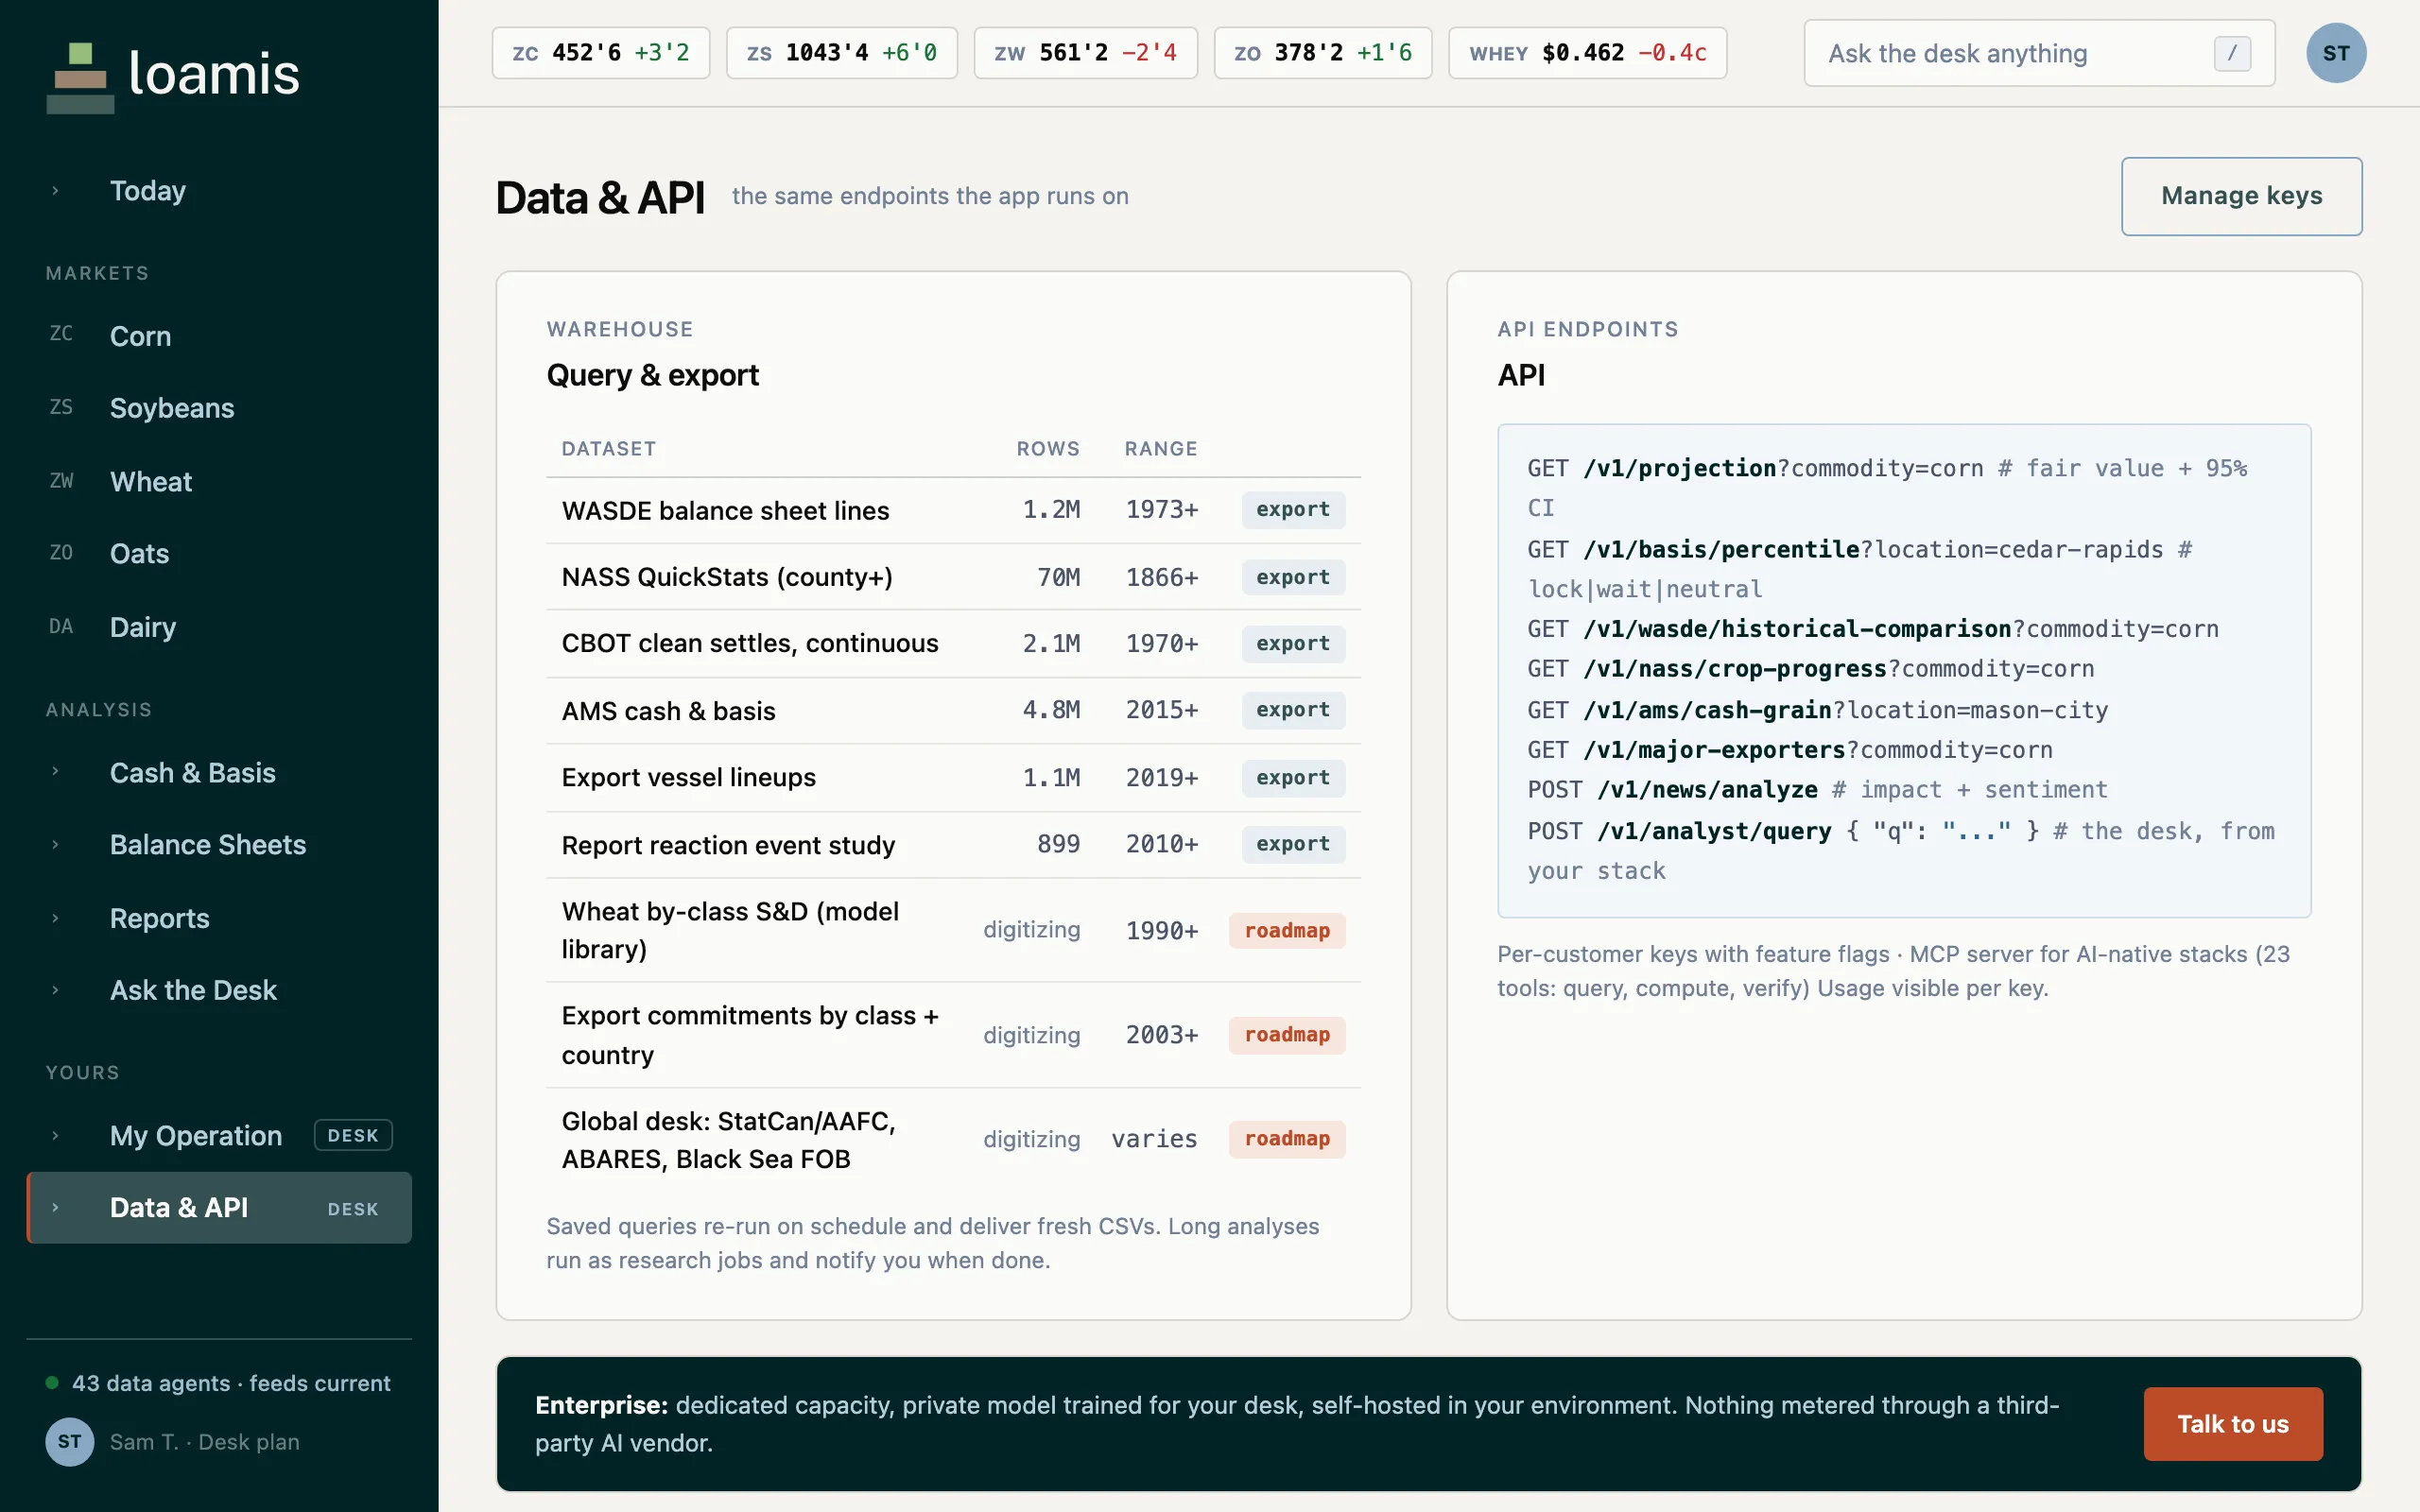
The catalog
| Dataset | Depth | Coverage |
|---|---|---|
| WASDE balance sheet lines | 1.2M rows | 1973 to today |
| NASS QuickStats, including county | 70M rows | 1866 to today |
| CBOT clean continuous settles | 2.1M rows | 1970 to today |
| AMS cash and basis | 4.8M rows | 2015 to today |
| Export vessel lineups | 1.1M rows | 2019 to today |
| Report reaction event study | 899 reports | 2010 to today |
In progress, and we will say so plainly
- wheat by-class supply and demand (1990+)
- export commitments by class and country (2003+)
- the global desk (StatCan and AAFC, ABARES, Black Sea FOB)
Where it comes from
- USDA
- NASS, WASDE, AMS, ERS, FAS, RMA
- Energy
- EIA petroleum, natural gas, international, total energy
- International
- FAO, Eurostat, CONAB, IBGE, Bolsa de Cereales, World Bank, IMF, FRED
- Weather and climate
- NOAA, NASA POWER, Open-Meteo, drought monitor
- Logistics
- FGIS, grain transport, vessel lineups
- Markets
- CME and CBOT settles, statistics, and definitions
Everything is connected through an ontology and a knowledge graph, which is why a question about export pace can reach the vessel lineup and the balance sheet in the same answer.
Everything is exportable.